

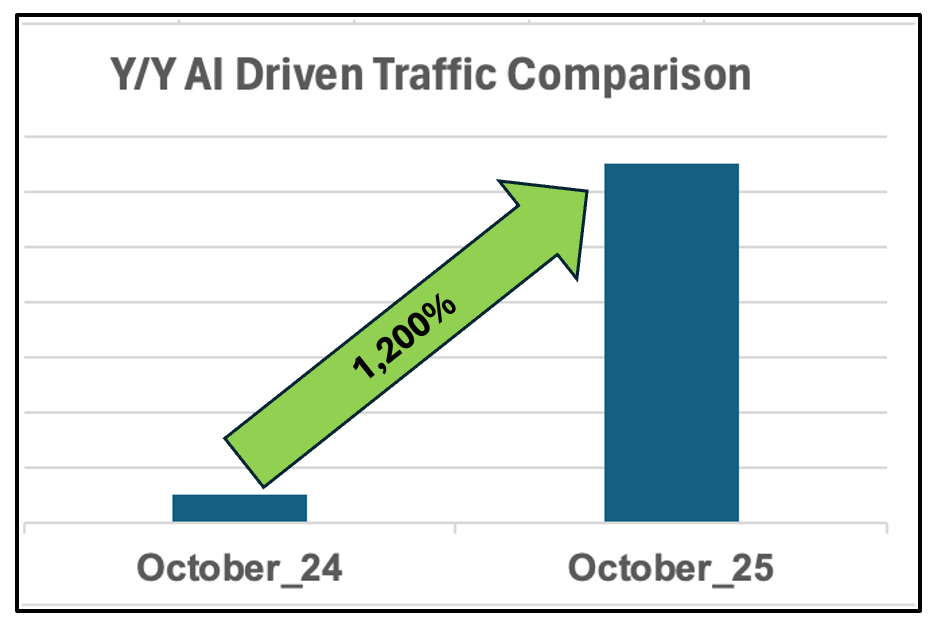
BREAKING: Adobe Reveals October Agentic Commerce Traffic Increase of 1,200% and Conversions Surge to +16% Compared to Other Traffic
ChatGPT's big ChatGPT-5 Product Search/Product Card improvements are bearing fruit as traffic quality and intent increases materially.

Today, Adobe is releasing their pre-holiday October 2025 analytics report and the report continues their trend of revealing dramatic shifts in the shape of not only traffic, but sales.
A Brief History of Agentic Commerce in ChatGPT
Before we jump in, let me take you back in time ⏳ to October 2024. ChatGPT is just 2 years old and they are previewing a Perplexity-like web search feature called SearchGPT with paid users that will come out of preview and go full general availability in Feb of 2025.
Here’s a timeline of ChatGPT’s major milestones as it relates to our world of Agentic Commerce:
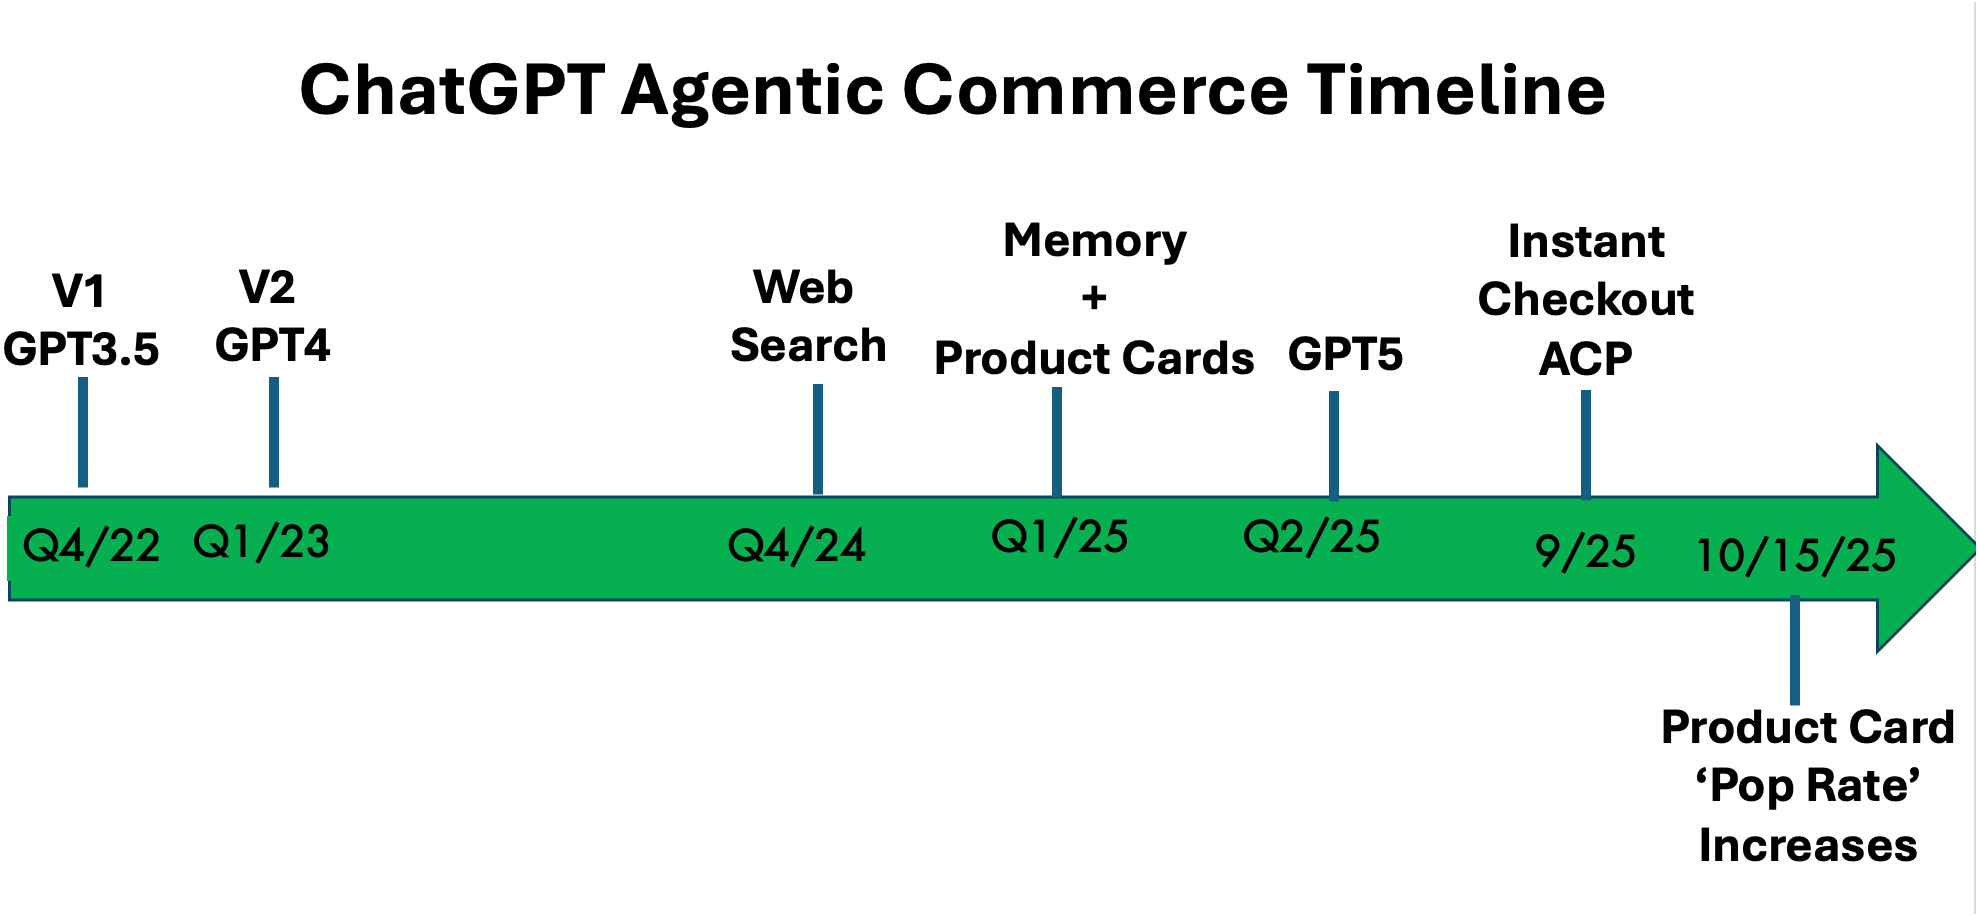
One are we haven’t covered directly at Retailgentic is we have noticed on the heels of the Instant Checkout/ACP 9/30/25 announcement, we noticed a significant up-tick mid-October in the number of prompts that result in a product card carousel being shown. We call this ‘popping a product card’ and the % of prompts that have a product card, or the pop-rate went up dramatically in this period. Also, ChatGPT is increasingly ‘recommended next prompt’ing a prompt that will pop a product card. For example, “Would you like me to look for good deals online with available shipping cost to your zip code?”
To recap:
October 2024 - no product cards, Research top-of-funnel product search capabilities.
Q1 2025 - Wide release of web search and introduction of memory and product cards start showing up with very low pop rate.
Q2 2025 - ChatGPT-5 released, product cards enlarged and pop-rate increases
September 2025 - Instant Checkout/ACP announced
Mid-October 2025 - Pop Rate takes step function up, increasingly frequent recommended prompts that will move the user through the funnel and pop a product card if not already popped.
Based on this timeline, what we’d expect to see in Oct 24 vs. Oct 25 these changes in behavior:
Substantial increase in traffic to retailers due to the move from no product cards and limited search to gen2 search and gen2 product cards
Improvement in conversion rate/quality of traffic. The 2024 traffic was coming from the ‘Research’ top of funnel and less intent was given by the user, therefore it would be natural for it convert poorly and, conversely, natural for it to convert substantially higher because in October 2025 consumers are well down the funnel between Find→Buy.
While we’ve focused on the ChatGPT timeline, Perplexity, Gemini and Copilot have all made similar moves in their commerce capabilities.
Let’s look at the data and see if this thesis holds true.
GenAI October 2024 vs. October 2025 Trends
For October, Adobe reports GenAI traffic is up a whopping 1,200% y/y, which looks like this:
On top of that they report that the conversion rate of GenAI channels vs. is now 16% better than “non-AI traffic sources such as paid search, affiliates & partners, email, organic search, and social media.”
Here’s the time trend from July 2025’s reported GenAI traffic conversion rate to October’s.
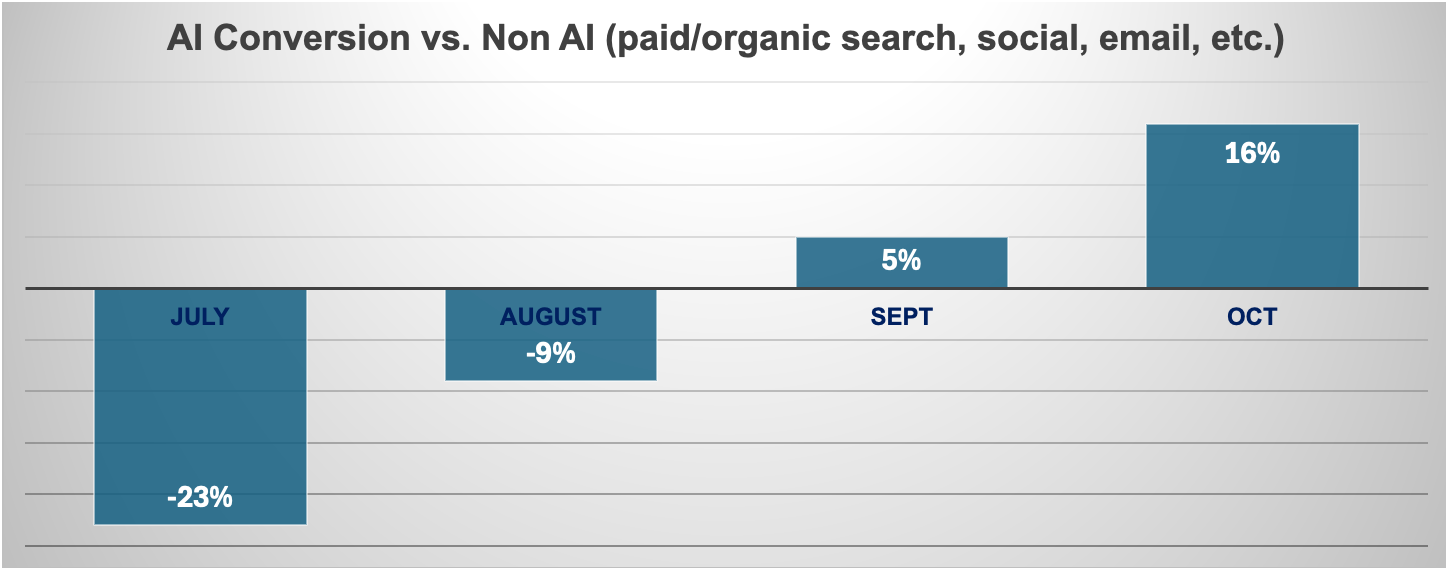
In this trend data you can really see the impact of the ChatGPT-5-centric Agentic Commerce improvements, through September where it not only caught up to other sources, but showed a slightly better conversion rate of 5%. Traffic that converts 16% higher and is un-paid, or organic, in nature is like it raining gold dust and helps soothe the sting of the decrease in organic google traffic.
Other Interesting Agentic Commerce Findings
Aside from the traffic surge and 16% better conversion rates, Adobe revealed:
Because of the conversion bump, GenAI traffic is generating 8% more revenue per session.
Shoppers from GenAI are 13.6% more engaged with 44% longer visits and 31% lower bounce-rate.
Non-AI Datapoints of Interest
Adobe reports that e-commerce grew 8.2% y/y in October 25.
This equates to $88.7B in transactions
BNPL for the month was $7.1B (8% of transactions) and up 7.6% y/y
Strong y/y growth categories were holiday decorations (+130% y/y), hand tools (+83% y/y), and refrigerators and freezers (+55%)
Social media traffic also over-performed coming in +28% y/y
Adobe Dataset
From Adobe:
Adobe’s data is based on analyzing commerce transactions online, covering over 1 trillion visits to U.S. retail sites, 100 million SKUs and 18 product categories. Adobe Analytics is relied upon by the majority of the top 100 internet retailers in the U.S. to deliver and measure shopping experiences online.