

New Consumer Behavior Data Reveals Details of How Shoppers Use Agentic Commerce and Impact on Other Channels: Time for a Retailgentic Deep Dive!
New polls from Harris, Visa, Adobe and Morgan Stanley AlphaWise give us a 'mosaic view' of what's going on with consumer behavior and agentic commerce in Q1 2026 ahead of earnings season.

First Principle Thinking for Digital Retail: Consumer Behavior
Last week I was on a Wall St analyst ‘expert channel check’ call. The analyst has been a long-time reader of Retailgentic and one of his questions a the top of the call was:
“I’ve been following you on the J+S show and now Retailgentic and your predictions have gotten really good, like north of 80%, how do you do that?”
My answer was, there are three things that I work on to help improve my ability to predict where things are going:
History/Incentives - I’ve been fortunate to have a front-row seat to the birth of paid-search, eBay, ecommerce, omni-channel, mobile, Amazon marketplace, social commerce, retail media networks and so-on. This history helps understand how big companies act, how the stakeholders in our industry react to change and what all the underlying incentives are. “Show me the incentives and I’ll show you the outcome” - Charlie Munger, Berkshire Hathaway
Shots on goal - Doing the Jason and Scot show for 11yrs gave me a decade of getting use to making very public predictions and having to be graded on them. This gave me tough skin, humility and a good understanding of how to frame a prediction along with the time window.
First Principle thinking - I would say the first 2 are 30% but the 70% comes from first principle thinking. History, incentives and practice matter, but first principle thinking I learned as being an entrepreneur for 30yrs. For many businesses, first party thinking goes back to physics or economics (incentives again). But for our industry, I realized about 10yrs into ChannelAdvisor that the ‘real’ first principle predictor for our industry is consumer behavior. Want to learn more about first principle thinking? Here are two good resources to get you going: (James Clear and Farnam Street).
Two Types of Consumer Behavior
In our industry there are two types of consumer behavior data:
Observed Consumer Behavior Data - In our industry, observed data comes from a variety of areas:
Platform layer - Ecommerce platforms like Adobe, Salesforce, BigCommerce and Shopify ‘see’ every transaction through the union of their customer’s sites.
Infrastructure layer - Above and below the ecommerce layer there are opportunities to ‘see’ what consumers are doing from search engines, marketplaces, analytics platforms, etc. (examples: IBM, Adobe, Salesforce also have elements of this data)
Panel data - There are companies that work with consumers to get permission to monitor their behavior, they then aggregate that data to understand consumer behavior (Examples: Similarweb and Sonar Tower)
Stated-preference Consumer Behavior Data - Stated preference is where a polling agency asks X consumers questions and then uses known statistical methods to ‘scale up’ the data to represent an audience. In our world, I look for:
Scale - n=1500 at a minimum (2k is preferred)
Audience - US online consumers
Recency - Agentic Commerce is changing so fast, you really need to look for not only when the survey results were published, but when the survey itself was conducted.
As my podcast partner Jason Goldberg would say, stated preference data is notoriously ‘tricky’ to the point of many times being unreliable. The classic example in our industry is if you ask consumers ‘would you like advertising’ they will say “no, I do not like advertising, I would never click on an ad”. How do you square that with Google, Amazon Ads and META.
Two ways to filter stated preference consumer behavior
Because stated preference, I apply two filters to the data:
Triangulation Filter - I like to accumulate 2-3 surveys that have similar topics, look at the ‘meta results’ and use that to triangulate to reality. This approach takes out the drift that comes from the underlying wording and ‘way’ the questions are asked.
Past/Present/Future Filter - Stated preference works best when you ask people what they have done and are doing. Where it gets especially fuzzy and unreliable is when you ask them about the future. Where it becomes totally unreliable is when you ask them about future economic decisions.
If we can ‘double triangulate that’s the best. What I mean by that is if we can find where observed behavior and stated behavior overlap, AND in the observed we’ve triangulated, and in the observed we’ve triangulated that’s the gold standard. Usually during the holiday period is the only time of year we can do that in ecommerce because the amount of data output cranks up.
For example in 2025, you may have noticed we would frequently in one post talk about a poll or two (stated preference) along with data from Adobe/Salesforce/Sensor Tower/Similarweb (observed behavior) - double triangulation!
Last week, Thursday, we had a big drop by Adobe for Q1 and in this post we’re going to double triangulate that data with 4 polls I’ve been accumulating from Q1 to get enough data to triangulate some stated preference data.
Four New Q1 2026 Consumer Behavior Polls
In this article, I’ll be referencing four Consumer Behavior Polls:
Adobe - In addition to the observed preference data we covered last week, Adobe also ran a stated preference poll of n=5,000 , US Online Consumers, Conducted March 2026
Harris/Quad AI Shopping Poll - Harris is one of the most well known polling companies in the US. Quad seems to have been the one to contract with them and sponsor the survey and publish the analysis. US consumers, Feb 2026, n=2180.
Visa - n=2,000 General Population US Adults, between 1/29/26-2/6/26
Morgan Stanley AlphaWise - I’ve been following this one since 2010 and I don’t know if it’s the longevity, the fact it’s a top-tier Wall St. firm building the survey and doing the analysis or what, but I’ve found it to be head and shoulders above all other polls - it’s my ‘go to’ stated preference data. For this dataset, n=2,000 US consumers aged 16-75, conducted 1/22/26-1/26/26
Four datasets, all within Q1 2026, all > n=2000 - this gives us a great foundation to ‘quadrilate’ on some data.
US Agentic Commerce Usage Trends
Let’s start by peeling the onion, starting on the outside. What do our four polls tell us about how consumers are using Agentic Commerce.
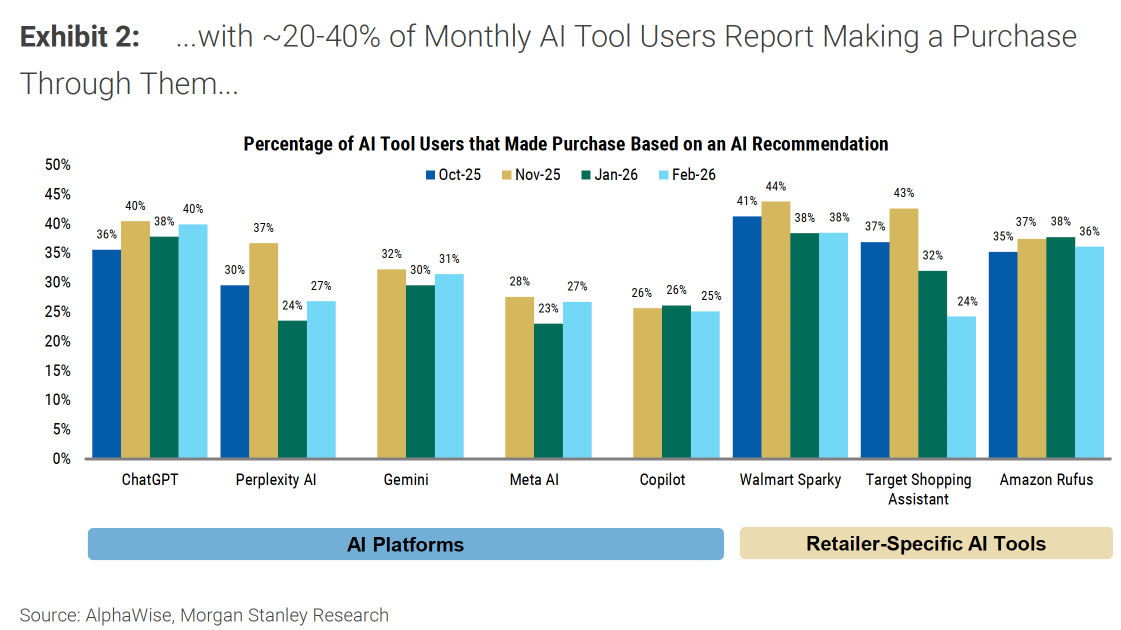
MS AlphaWise data above has time trend data from 10/25-2/26 and shows continued activity by consumers in the 20-40% range that ‘made a purchase’ based on an AI recommendation. Think of this as a Discovery signal. Usually in ecommerce we see a Holiday bump, then a Q1 slump, the a recovery with a new high in Q4 for the next Holiday period. Here we’re not seeing that. Note that Meta jumped 4% the most - remember that Product Cards rolled out in Q1 (we noticed them in early March).
That being said, the ‘Retailer-Specific AI tools’ section did see a bit of a Q4→Q1 decline for Sparky and TSA fell off a cliff with usage going from 43% down to 24% - a 19% drop, but interestingly Rufus is hanging in there at ~40%
The Visa poll lines-up stating:
“Nearly 40% of Americans have made a purchase they normally would not have considered as a result of using an AI agent or tool.”
It’s interesting Visa asked the ‘would not have considered’ question, I’ve long theorized that Agentic Commerce would accelerate overall ecommerce. This datapoint supports there is some incrementality here. It’s hard to tell if they were shopping for something already and found a new brand, or if it was totally organic. We’ll be watching the commerce data for information on that. If it’s going to happen, I think we’ll see it Holiday 26.
The Harris poll goes into some demographics and reasoning behind ‘why’ Agentic Commerce:
Sixty-two percent of Gen Zers and Millennials said they prefer to shop using AI-powered tools, a larger share than consumers overall (51%), to reduce the risk of making a bad purchase.
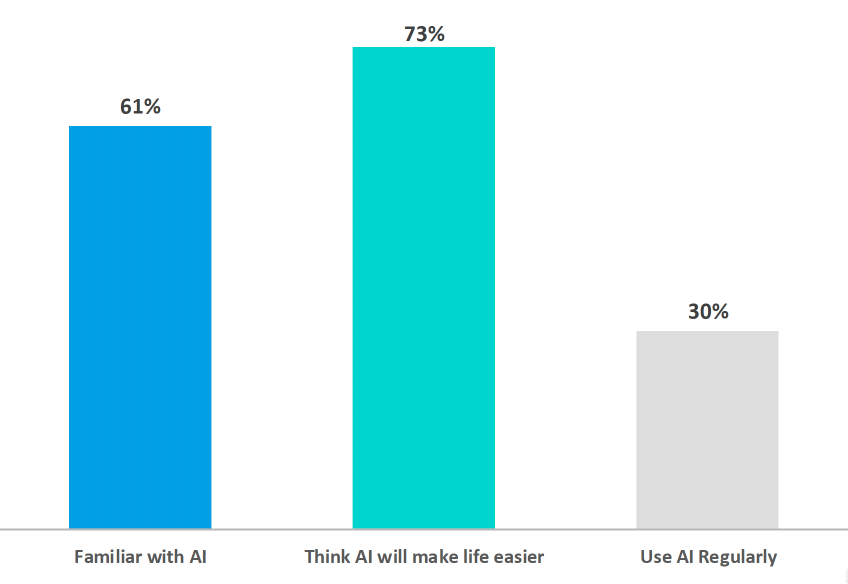
Finally, Adobe has AI Regular usage at 30%, 61% familiarity and ‘positive vibes’ at 73%:
How/Why Are Consumers Using Agentic Commerce?
What do consumers like/dislike about Agentic Commerce? This information helps us get to the underlying reason Agentic Commerce is popular.
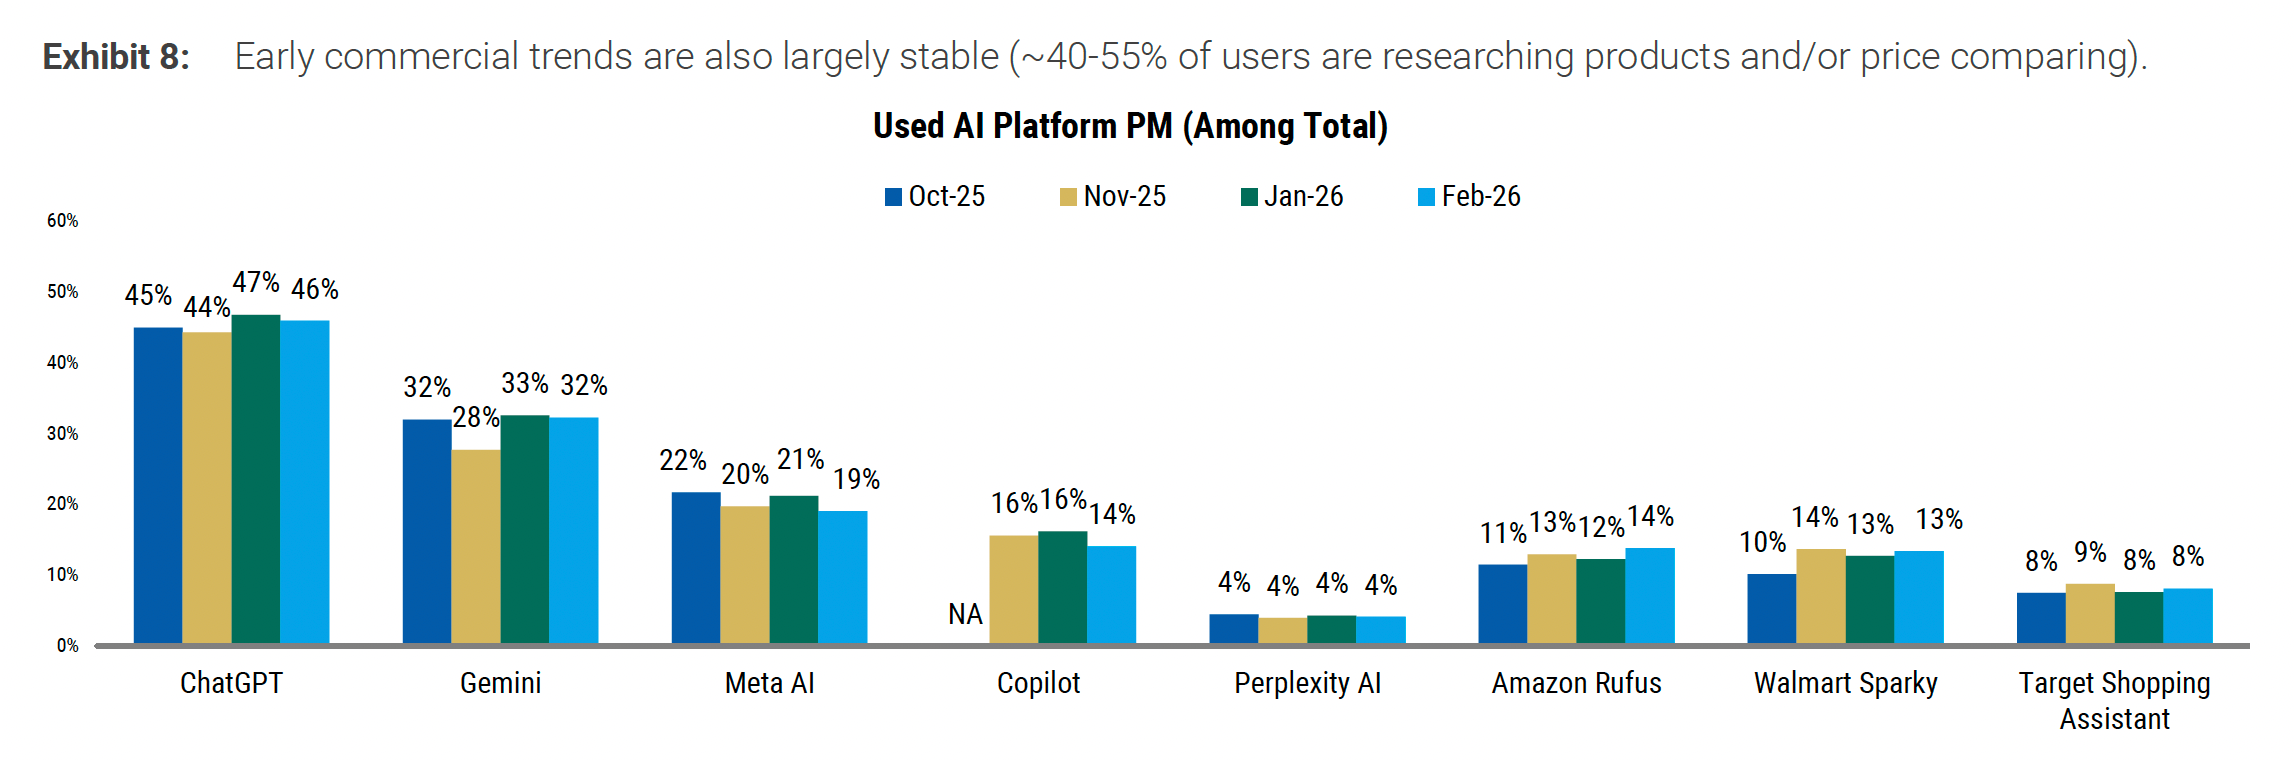
The AlphaWise report goes through 10 different reasons, I pulled this one as it’s the largest - 40-55% of consumers are research products and/or price comparing.
The Harris poll has some more color on this:
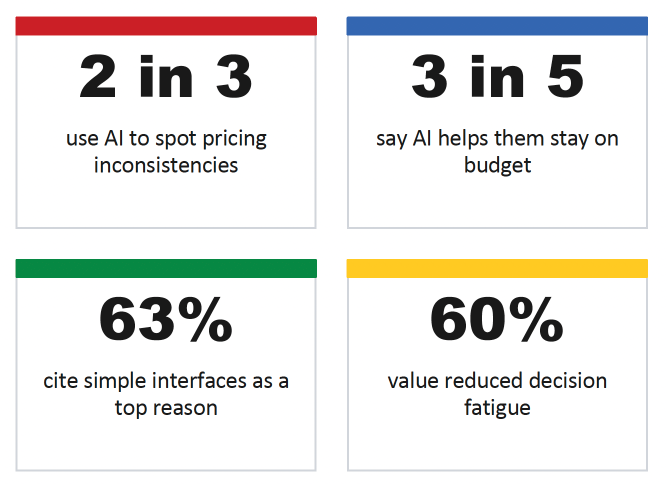
These are some new reasons I haven’t seen before: decision fatigue reduction, staying on budget, spotting price inconsistencies and the top we’ve seen before: simpler interface. This last one speaks to the ‘broken-ness’ of the existing ecommerce search experience both at the individual retailer level and the google level. As retailers implement LLM/Agentic commerce type technologies on their websites, it will be interesting to see how this changes.
Trust and Agentic Commerce
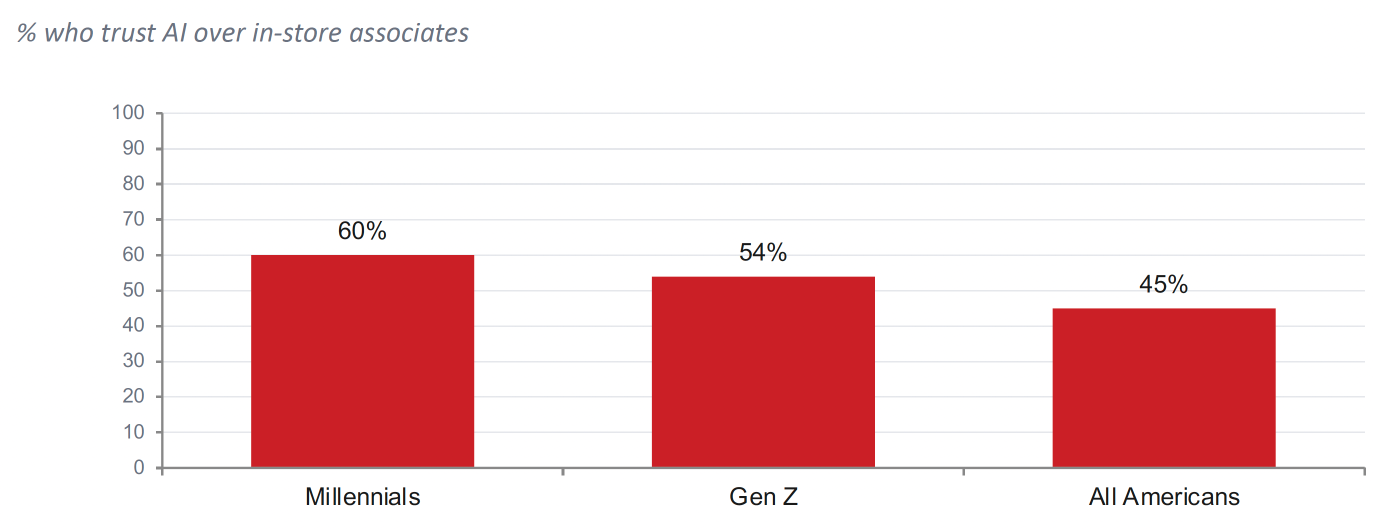
Harris also had some trust questions that are interesting. This one across demographics caught my eye. 45% of all american’s trust AI over store associates with Millennials over-indexing at 60%.
Agentic Commerce Demographic Trends
This batch of polls produced a wealth of new demographic trend data for Agentic Commerce, here are the highlights:
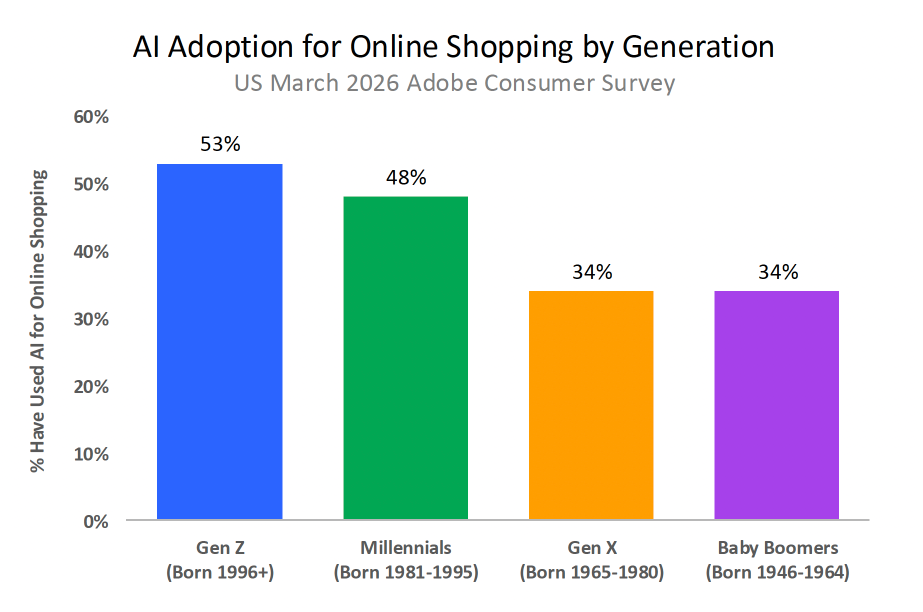
Adobe has a both adoption data from GenZ to Boomers:
And then breaks the demos down across three ‘why agentic commerce’ questions:
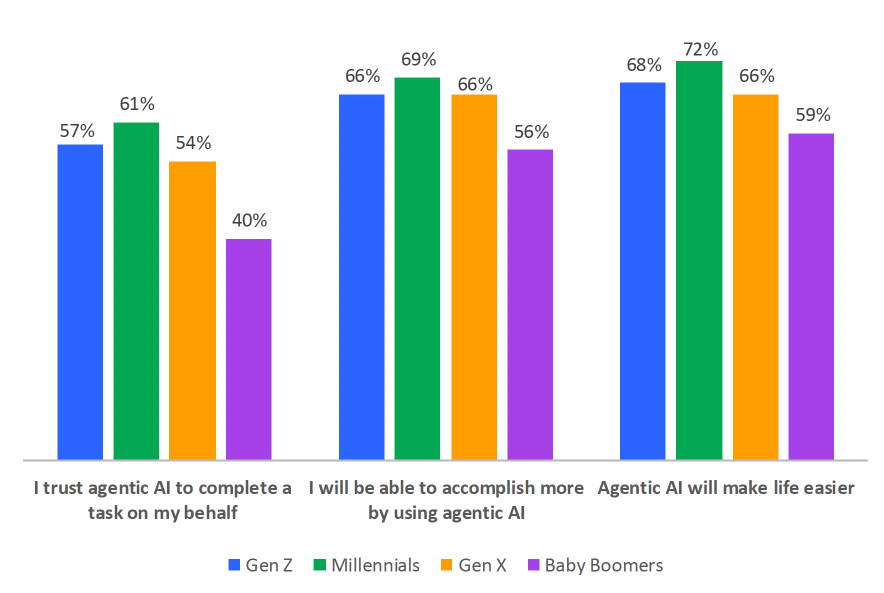
This shows us that younger consumers, especially Gen Z and Millennials, are more likely to use AI assistants across the full shopping journey, from discovery to post-purchase. Confidence in AI-driven purchase decisions is consistently high across generations, but drops slightly among older cohorts, indicating trust gaps.
One other datapoint I noted is younger shoppers (Zillennials as I’ve heard many marketers say for GenZ+Millennials as a cohort) report Agentic Commerce is reducing returns (make sense, better research and decision making results in down-stream return improvement). This trend is strongest among younger shoppers, showing they are trusting the agents more and putting in the work.
Agentic Commerce and Ads
I always try and understand if a poll has a motive of some kind (back to incentives). I thought it was very interesting that the Harris poll really drilled in on that. I’ll also point out that these questions are definitely into the ‘future’ section I warned about and I’m sure the Agentic Commerce Naysayers are going to pounce on this. With those caveats here we go:
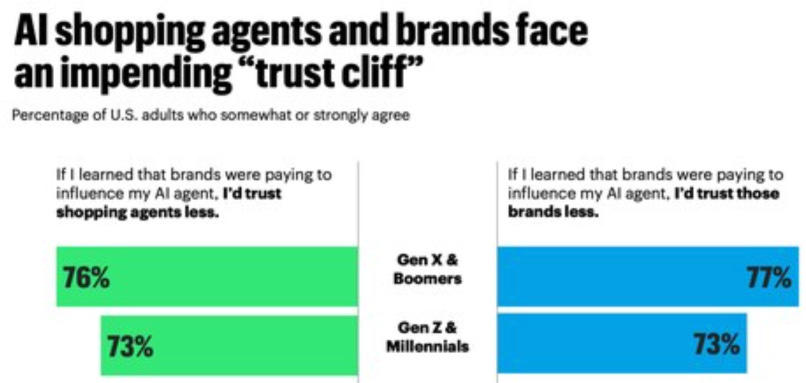
Yep, you can hear the soundbite now: 75% of consumers would lose trust in AI if there were ads. Who do you think would benefit the most from that datapoint being out there? I’ll give you a hint - think about some controversial superbowl ads from February….
On top of that the consumer survey around the AI companies showing the ads, the poll results are firing warning shot at brands saying: “If you advertise on this, you will destroy your trust too!”.
Personally, I’m going to take a wait and see approach on this. Brands advertise on Amazon, Meta, Instacart and Google and consumers keep coming back for more, so something doesn’t pencil here.
This is a shining example of the flaws with stated preference. I think ChatGPT/OpenAI totally know this is nuanced and they are going to delicately approach advertising and figure out ways to do it that are additive to the discovery and checkout experiences.
Agentic Commerce’s Impact on Social Media and Retail Stores
The Harris poll had some interesting data on the knock-on effects of Agentic Commerce.
This one caught my eye:
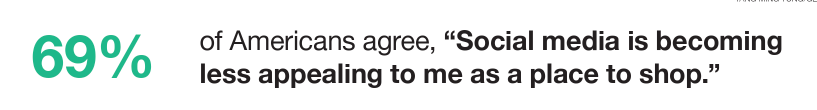
Perhaps this helps explain the urgency we’re seeing from Meta to enter the race. Consumers now have something to compare social media commerce to and are increasingly preferring Agentic Commerce.
The Harris poll picked up on three signals around physical stores:
First, they found that:
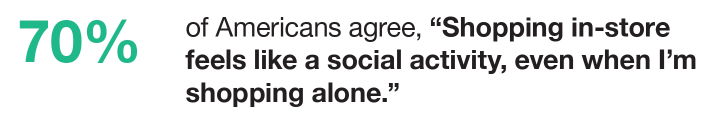
Putting on my first principle thinking hat here, ‘agree’ is a tricky word in polling, we’d have to see the wording of the question, (e.g. It’s probably something like: “shopping stores feels like a social activity, even if I’m alone: strongly agree/agree/neutral/disagree/strongly disagree and I bet they added the agree/strongly). The math works, but who would say: disagree or strongly disagree?
In any case, I’ve made a mental note to track this in future polls.
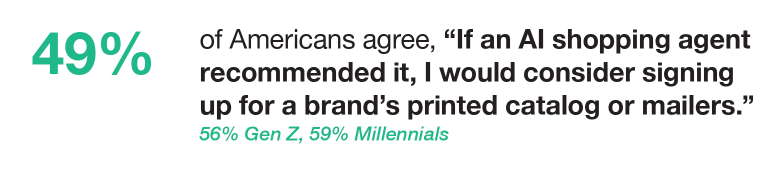
This next datapoint suggests that there are latent opportunities for retailers to leverage Agentic Commerce to acquire customers and harmonize/omni-channel them into the store through email sign-up or catalogs:
Finally, Harris found that 52-55% of Zillennials use Agentic Commerce while they are in-store to shop as a personal shopping assistant:
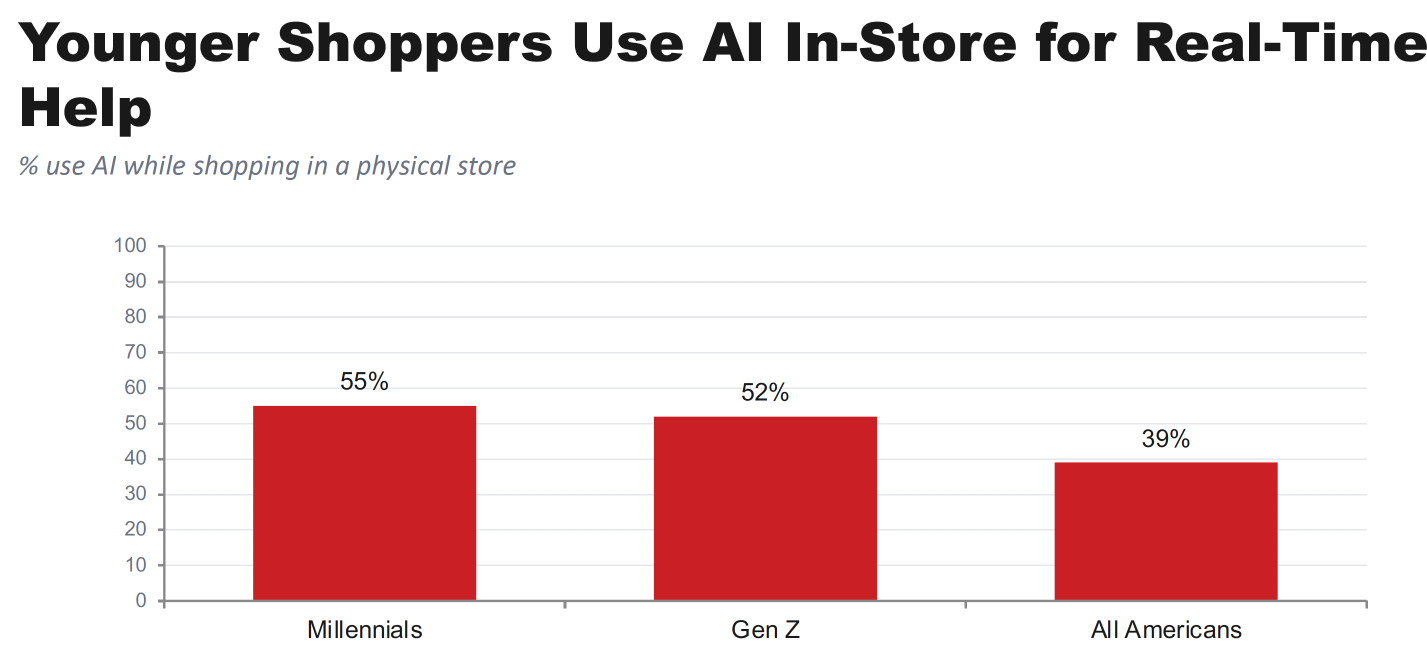
I recently witnessed my 19yr old daughter do this in an Ulta store - she pointed ChatGPT at a wall of lip-liner products with ChatGPT in voice mode and asked it which product met her three criteria and it said: brand x on the right three up from the bottom and four from the right. She referenced decision fatigue as the use case. Anecdotal, but another n=1 datapoint!
Summary
Highlights from this analysis:
We talked about the two types of data and the importance of first-principle thinking and triangulating on data across the observed and stated preference datapoints. We looked at the intersection/highlights of four polls: Adobe, Harris/Quad, Visa, MS Alphawise
20-40% of consumers using AI are making a purchase through them.
We did not see a ‘Q1 slump’ after a huge Agentic Commerce across the Agentic Commerce Engines, but we did see a pretty big drop in usage at Target Shopping Assistant and less of a decline at Sparky, but Rufus stayed robust at 36% (AlphaWise)
In Q1, 40% of americans made a purchase they normally would not have considered using Agentic Commerce. (Visa)
Generationally, 62% of GenZ’ers prefer AI powered shopping tools (Harris)
The top reasons why consumers use Agentic Shopping: To spot pricing inconsistencies, reduce decision fatigue and they prefer the simpler user experience.
50-60% of Zillennials now trust Agentic Commerce more than a store associate
As with previous surveys, Zillennials lead the pack in Agentic Adoption, but Boomers are up to 30-40% adoption where they have been below 20% historically.
70-76% of consumers rejected the idea of ads in Agentic Commerce saying they would lose trust if that rolled out and they’d also throw the brand under the bus too - this datapoint is suspicious at best.
39% (much higher for Zillennials) use Agentic Commerce as an in-store shopping assistant and 49% of all shoppers agree that if an AI shopping assistant recommended a newsletter or catalog, they would sign up.
When an What is the Next Big Data Drop?
Starting next week April 27-May 8, the companies we watch closely: Microsoft, META, Alphabet/Google and Amazon. Meta, Alphabet and Amazon all had comprehensive mentions on their last quarterly earnings referring to various aspects of Agentic Commerce. Here’s what we’ll be monitoring for and sharing here on Retailgentic to give you a bit of preview:
META - Zuck said back 1/29/26 they would be releasing Agentic Commerce soon and they did - will they go into more for their Q1 earnings release?
Google - Sundar highlighted their NRF release of UCP - will we get a progress report or a hint at things to come?
Amazon - Jassy dropped that Rufus was used by 300m consumers, it increased the probability of purchase 60% and drove 10-12B of incremental revenue. We’ll be looking for an update and also Wall St. is eager to hear about the sponsored prompts testing.
Microsoft - While not part of earnings, right after they announced their checkout and big push in a blog post, will we get an update/mention in earnings this time?
Walmart - Retailers are on a different schedule, they will report more mid-May. Last Q the CEO John Furner touched on Sparky saying that half the mobile users had tried it. It’s time for Sparky to come to the web, we’re all waiting on that and looking for any indications about their ad test.
Google I/O
After earnings season we head right into Spring conference season with Google I/O set for May 20+21 in Mountain View. Last year this is when the now already obsoleted ‘Buy for Me’ was announced and they officially ‘Entered the Agentic Commerce arena’ - our coverage was here.
Details on Sources for this article
If you want to go deeper, here are the sources for the four polls mentioned in this article:
Morgan Stanley AlphaWise
This data is only available to MS clients, If you work for a public company, you probably have a relationship (ask the CFO or investor relations) and they can get the report for you. AlphaWise cuts across all their research, what you specifically want is this report by Brian Nowak, their internet analyst and friend of Retailgentic→ (don’t let the title misdirect you, the great AlphaWise data is in the back if you’re not excited about SMB advertising).
Visa Poll
Press release is here and the detailed report is here.
Harris Poll
Press release is here.
Coverage with anti ad messaging here and here.
Full PDF is here→
Adobe Poll
Announcement is here and the PDF is attached for your convenience:
Up Next on Retailgentic…
We’re working on an Agentic Commerce news update that will be out either Wed or Fri depending on how the week develops, stay tuned, lots to update you on in the rapidly evolving world of Agentic Commerce!
We also have our standard Thursday pod drop for your listening/viewing enjoyment as well!
Great analysis Scot. You would have been a terrific eMarketer analyst!
Great analysis. Raises questions about ballooned up investments in social media / commerce, and marketing to agents.
Thanks for sharing!